Superkart Sales: Machine Learning Project in Python
SuperKart is a fictional organization that owns a chain of supermarkets and food marts providing a wide range of products. They want to predict the future sales revenue of its different outlets so that they can strategize their sales operation across different tier cities and plan their inventory accordingly.
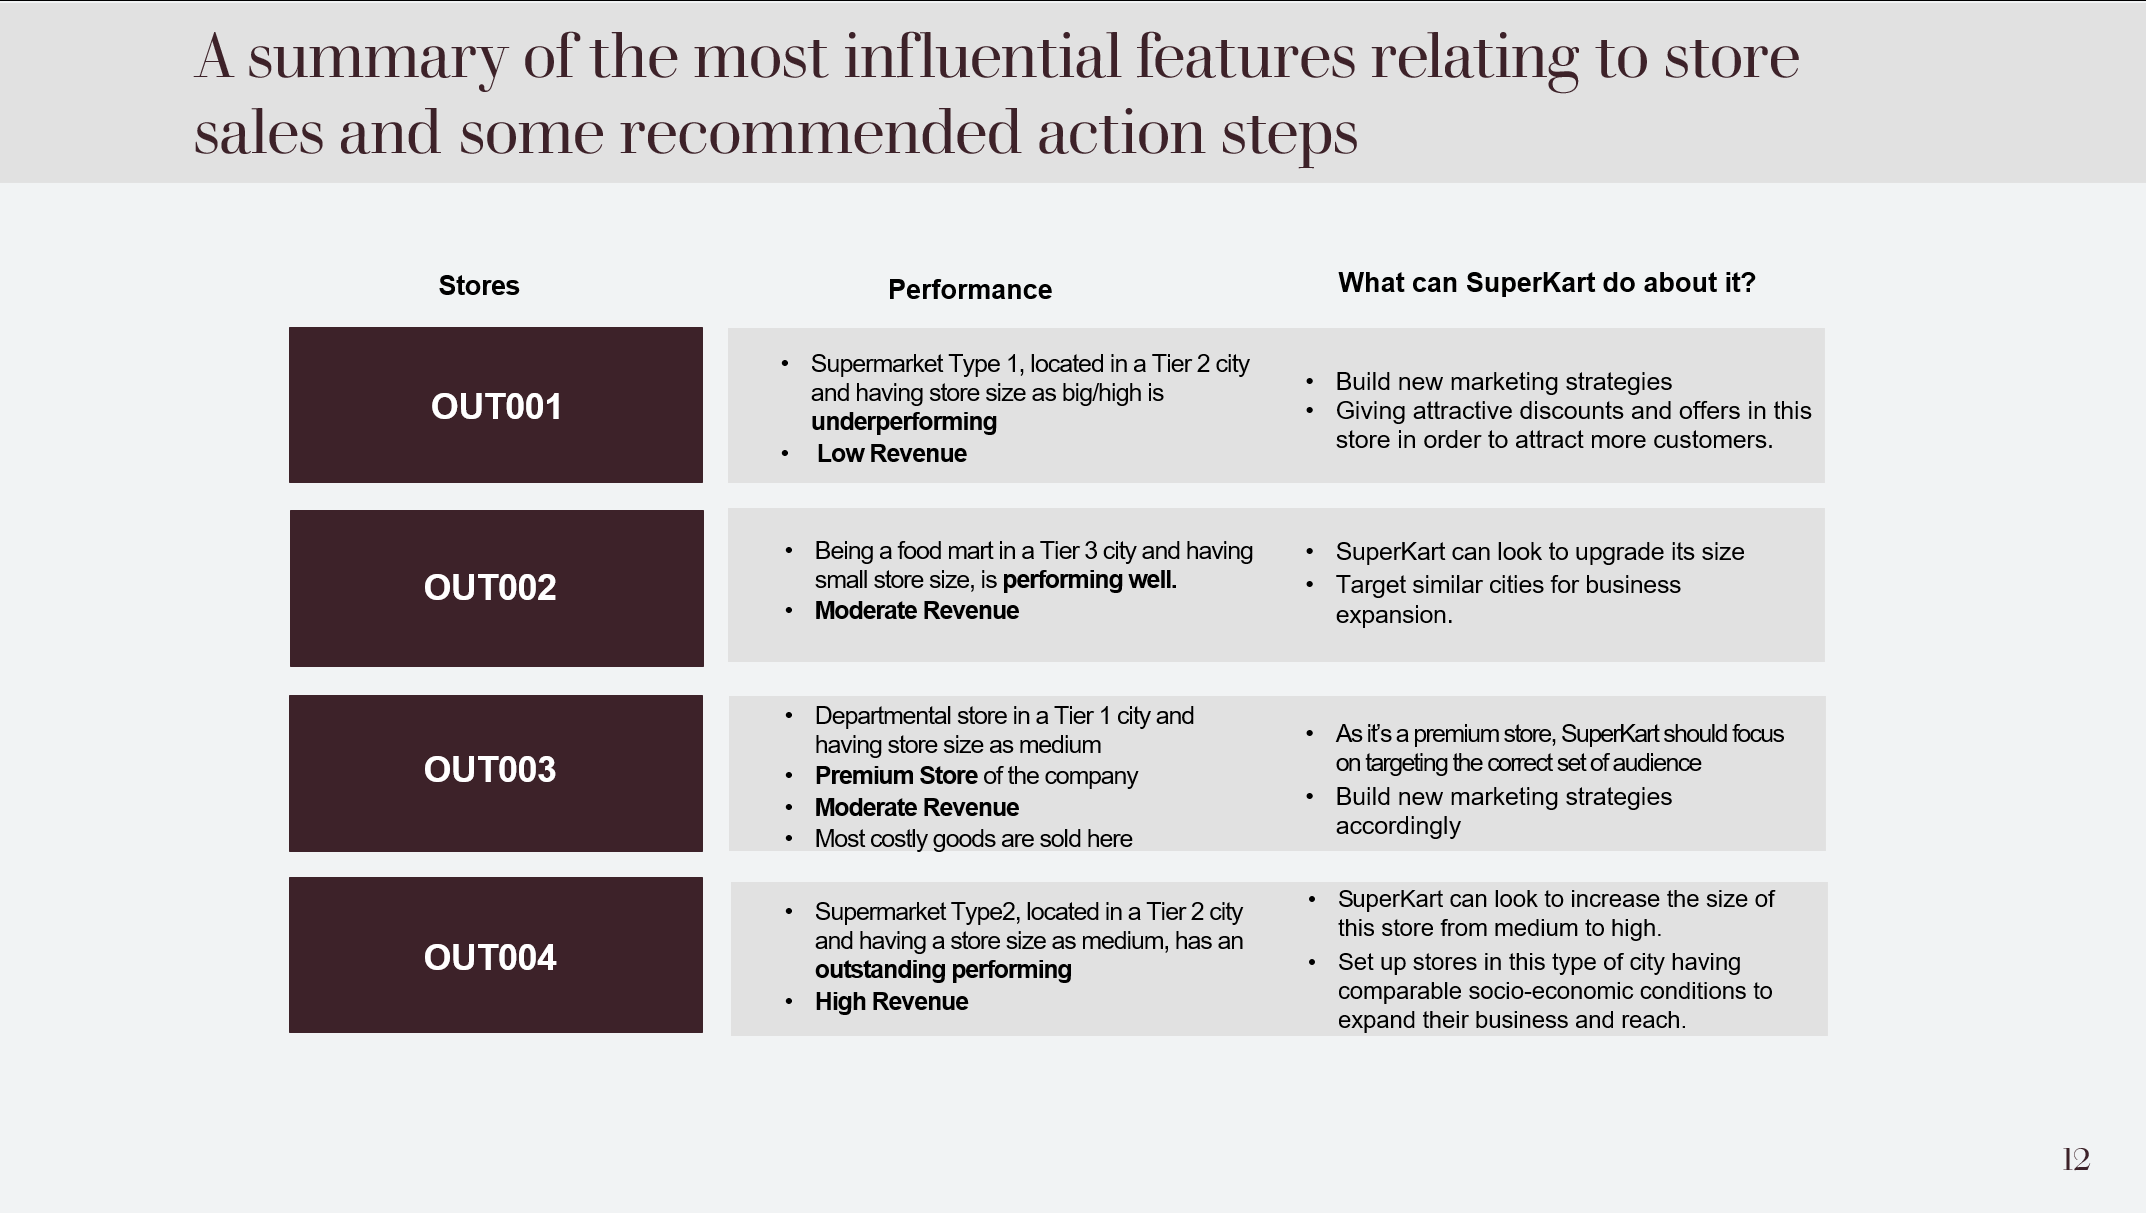
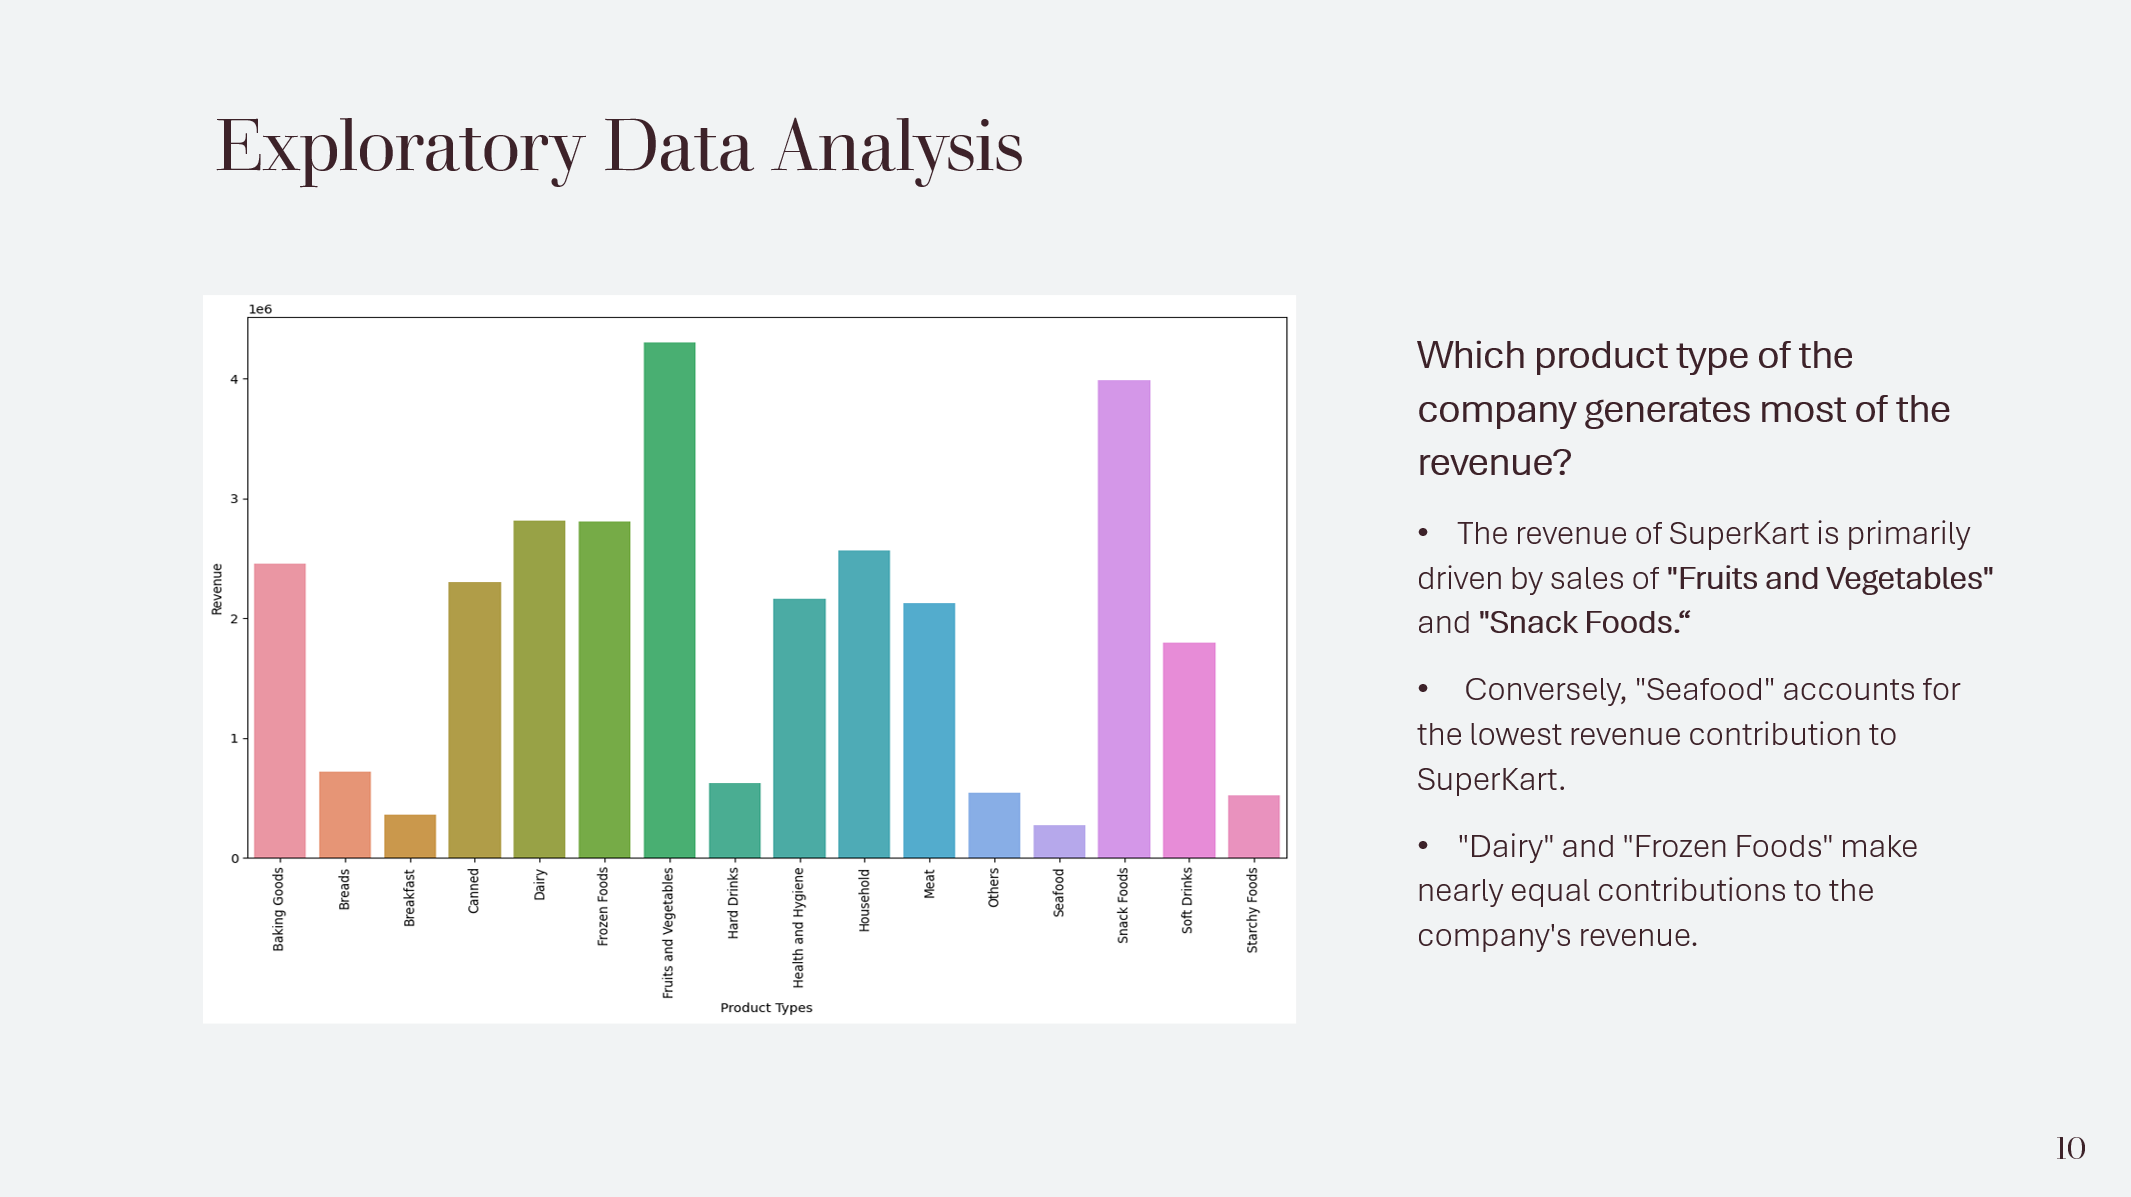
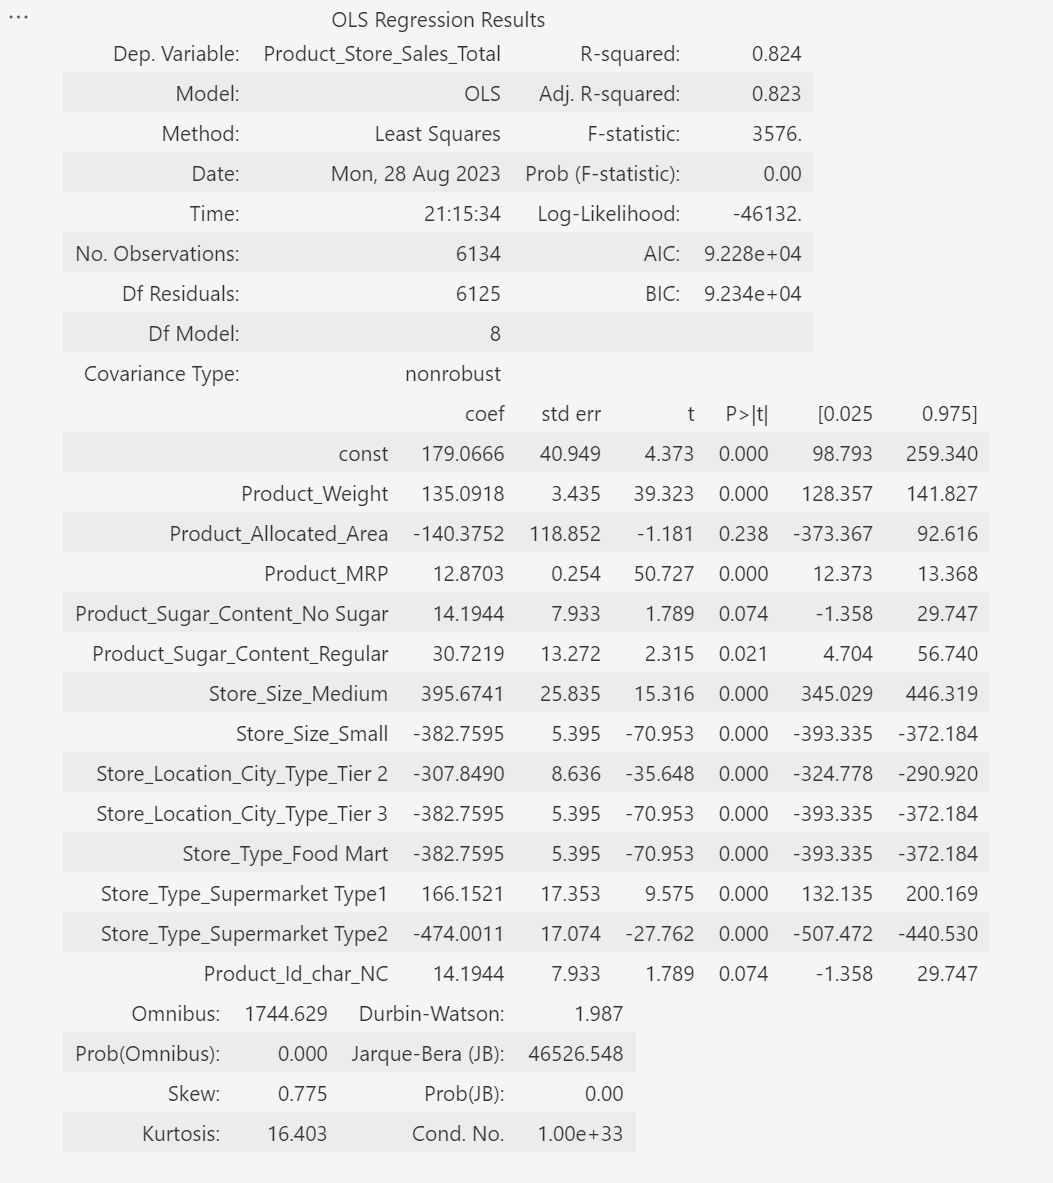
In this MIT PE project, I build a model to predict the total sales that will be done by SuperKart in the next quarter. The model explains around 82% of the variation in the data. Furthermore, each category was carefully analyzed through EDA to draw insights and create recommendations.
But the impact of this project goes beyond the numbers. I've made the findings and insights easily accessible through a dynamic PowerPoint presentation and an intuitive web application where you can put the features values and it will give you the SuperKart sales in the next quarter. This innovative approach ensures that our discoveries are not only robust but also comprehensible to everyone.
Tools: Visual Studio Code
Tech Language: Python (for building the model), HTLM, CSS and JavaScript (for building the website)
View my PPT presentation on Github
View my Machine Learning Project in Python on GitHub
Visit the website I made to calculate Superkart next quarter sales
View how I build the website using HTLM, CSS and JavaScript on GitHub
Some slides of my PPT presentation