KPMG Virtual Intership
This project was undertaken as part of the KPMG Virtual Internship program (see certificate here). The primary objective was to assist Sprocket Central Pty, a mid-sized organization specializing in bikes and cycling accessories, in effectively analyzing their data and optimizing their marketing strategy.
The project encompassed three key tasks. Firstly, a comprehensive data quality analysis was conducted using Python on four provided datasets, leading to the creation of a concise and insightful report.
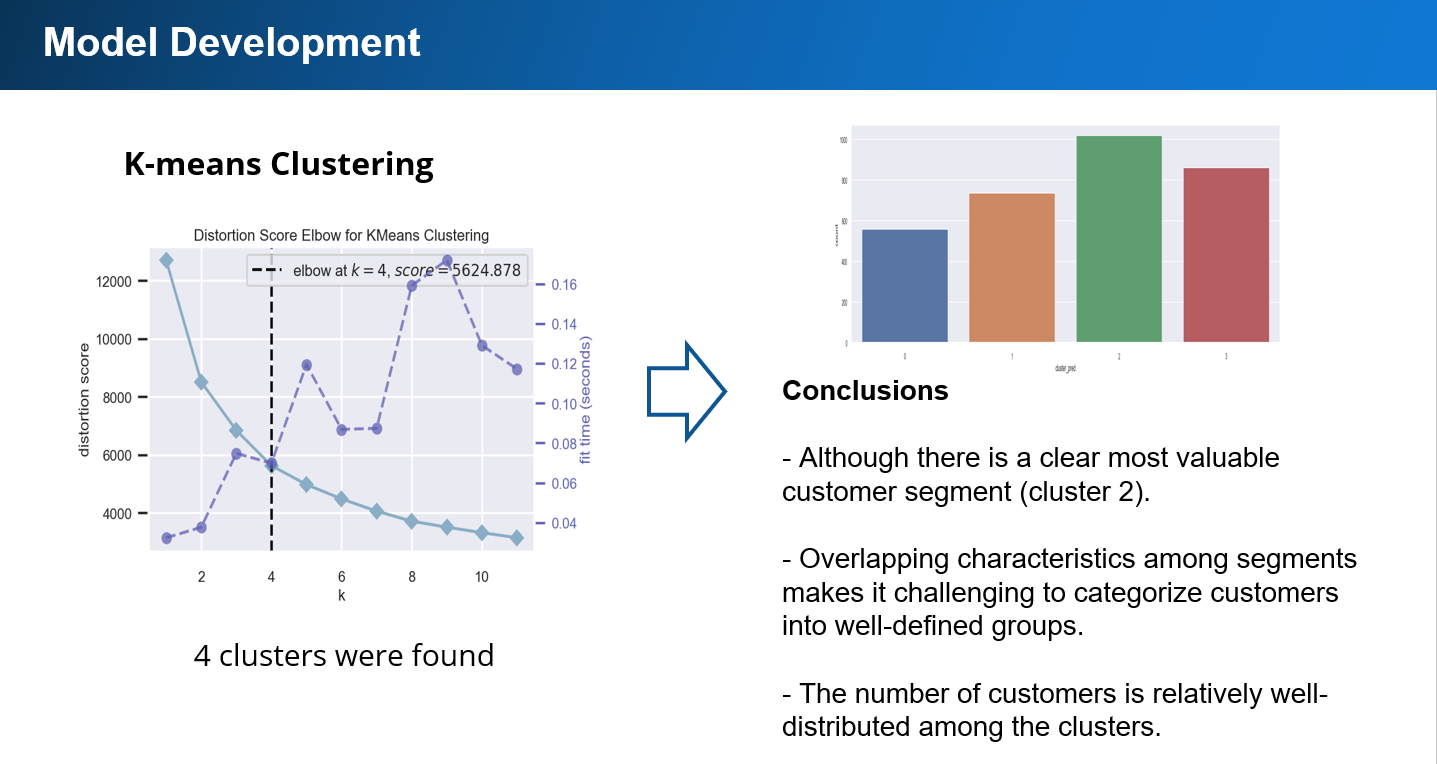
Secondly, a cluster analysis was performed, comparing various clustering techniques such as K-means, K-meloid, and RFM Plus. The goal was to identify the most suitable method for segmenting customers and analyzing the unique characteristics of each segment. As a result, four distinct customer segments were defined: active customers (high-value), good customers, average customers, and inactive customers. These findings were presented through an engaging PowerPoint (PPT) presentation, which not only showcased the results but also provided an explanation of the model used.
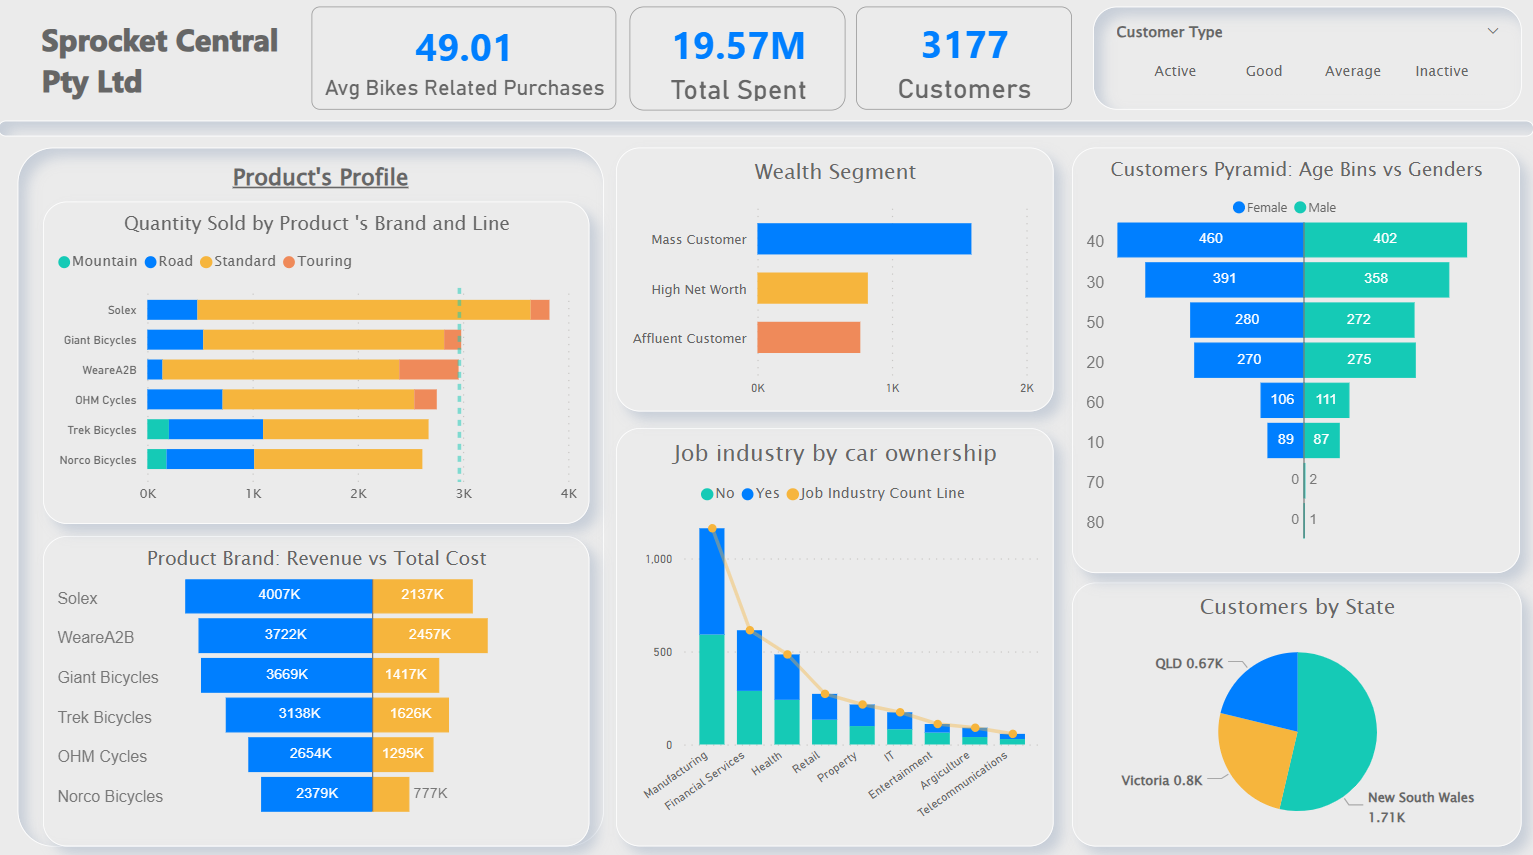
Lastly, a dynamic PowerBI Dashboard was developed to visually represent the insights in an interactive manner. This dashboard allows users to explore and manipulate the customer segments, gaining a deeper understanding of their specific characteristics.
In summary, this project combined data analysis, clustering techniques, and dynamic visualization tools to provide Sprocket Central Pty with actionable insights and a refined marketing strategy
Tool: Visual Studio Code, PowerBI
Tech Language: Python
Task 1: View my Data Quality Analysis in Python and View my PDF Report
Task 2: View my Cluster Analysis in Python and View my PPT Presentation
Task 3: View my PowerBI Dashboar on Github
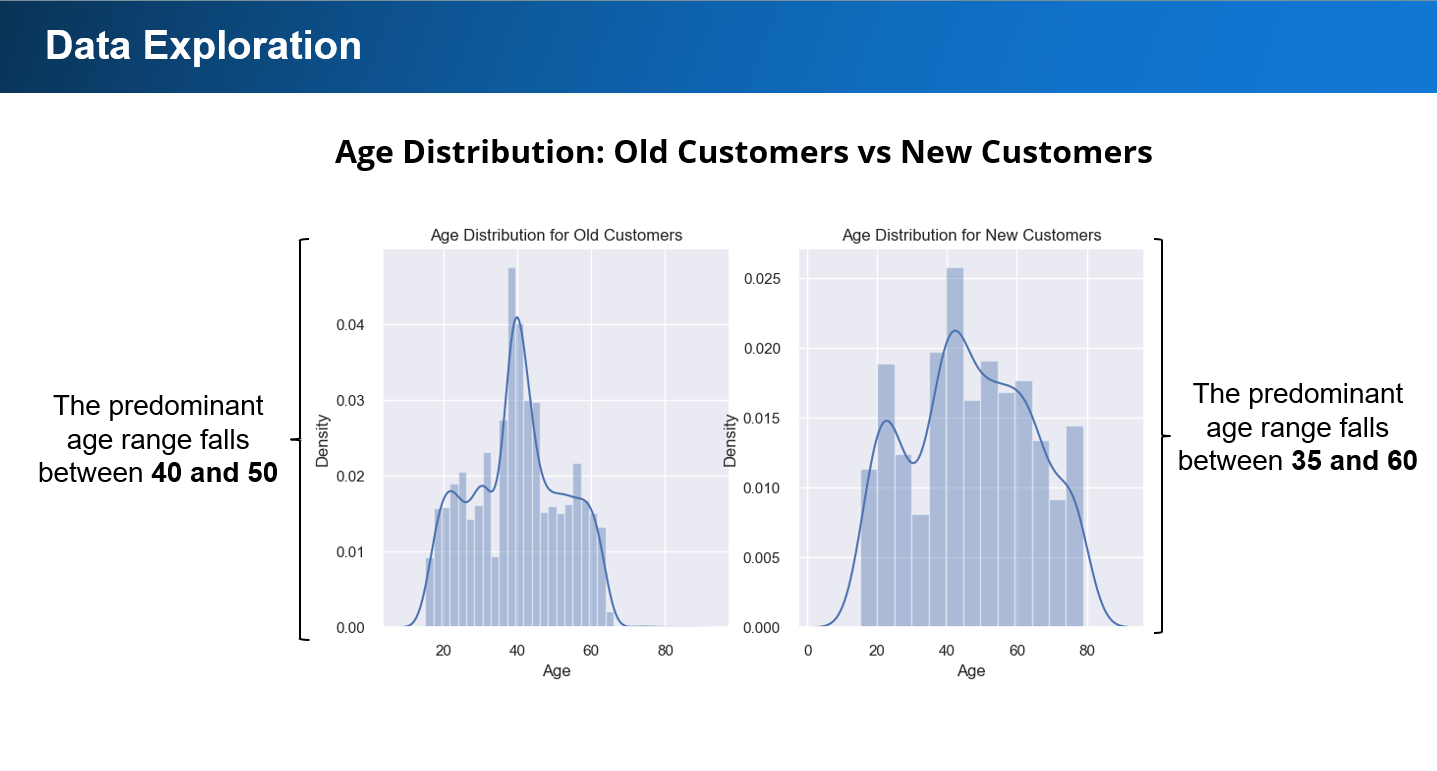
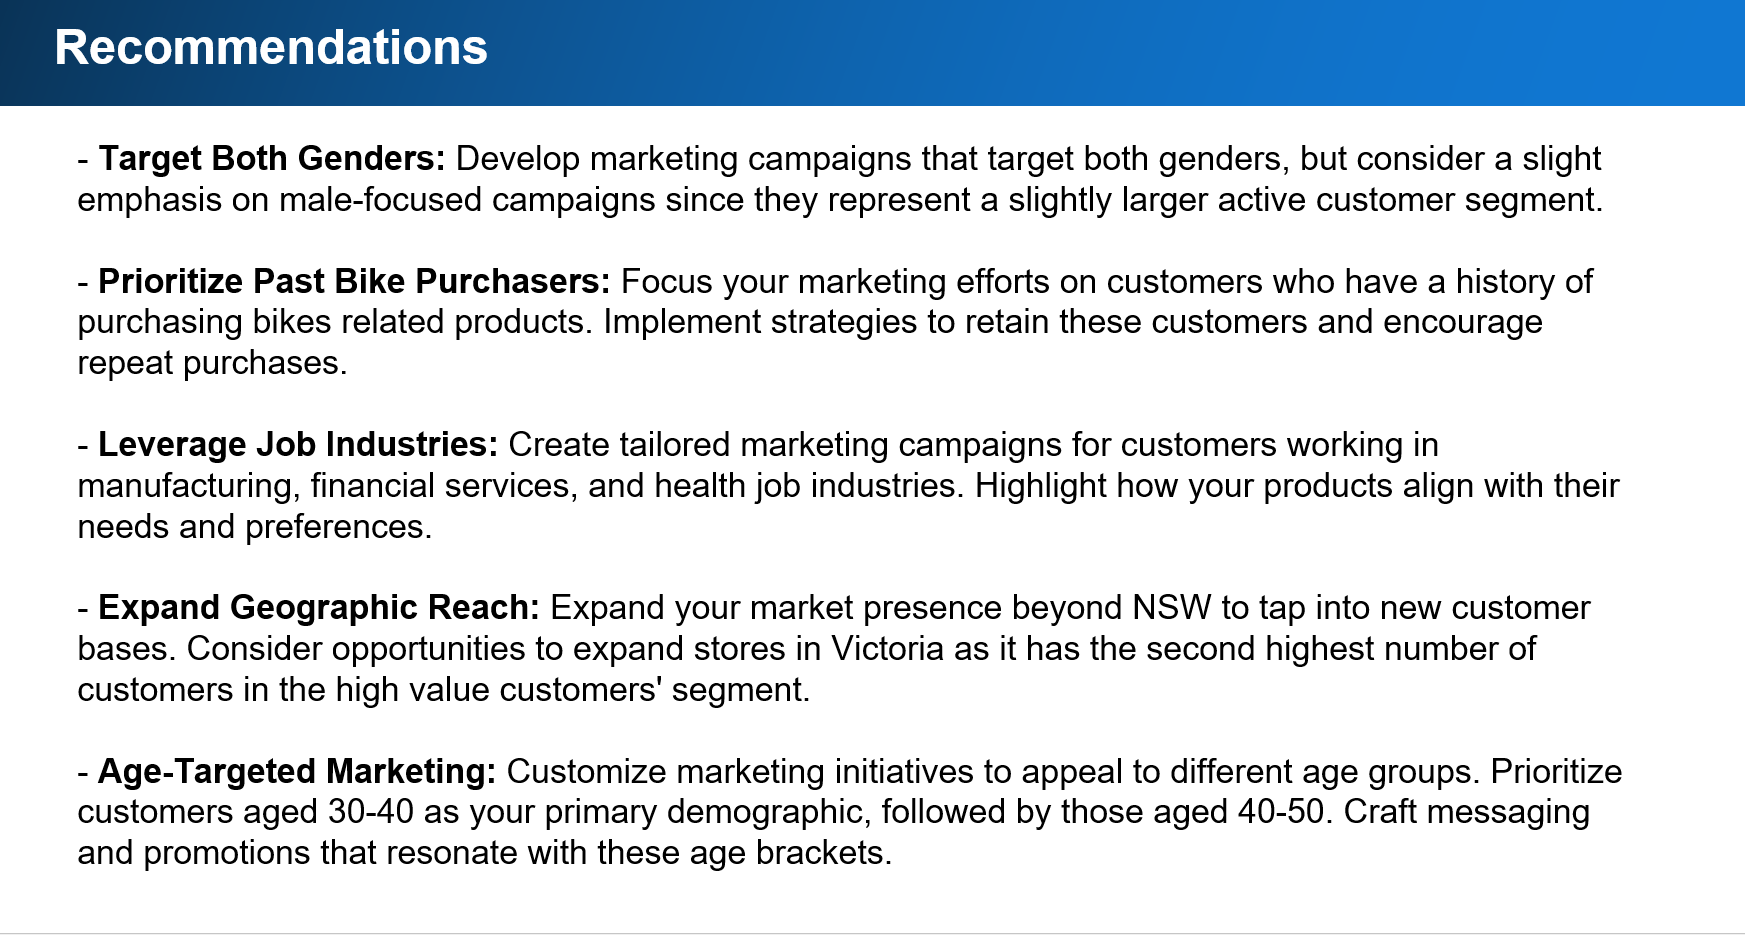
Some slides of my PPT presentation