Pizza Sales Analysis: MySQL and Tableau Project
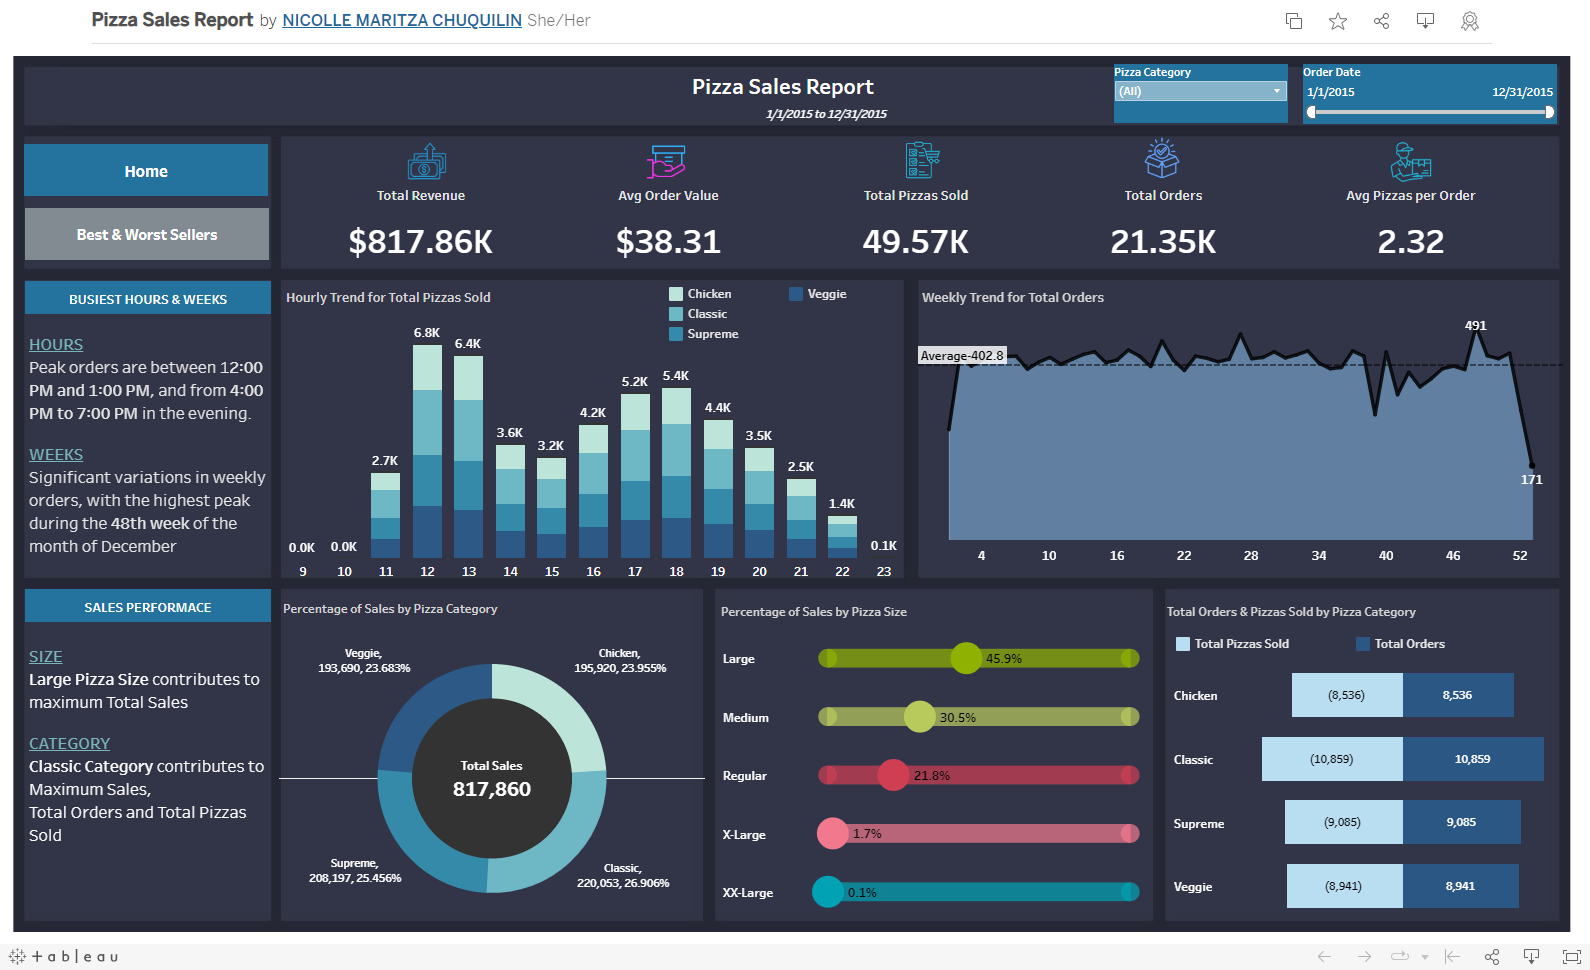
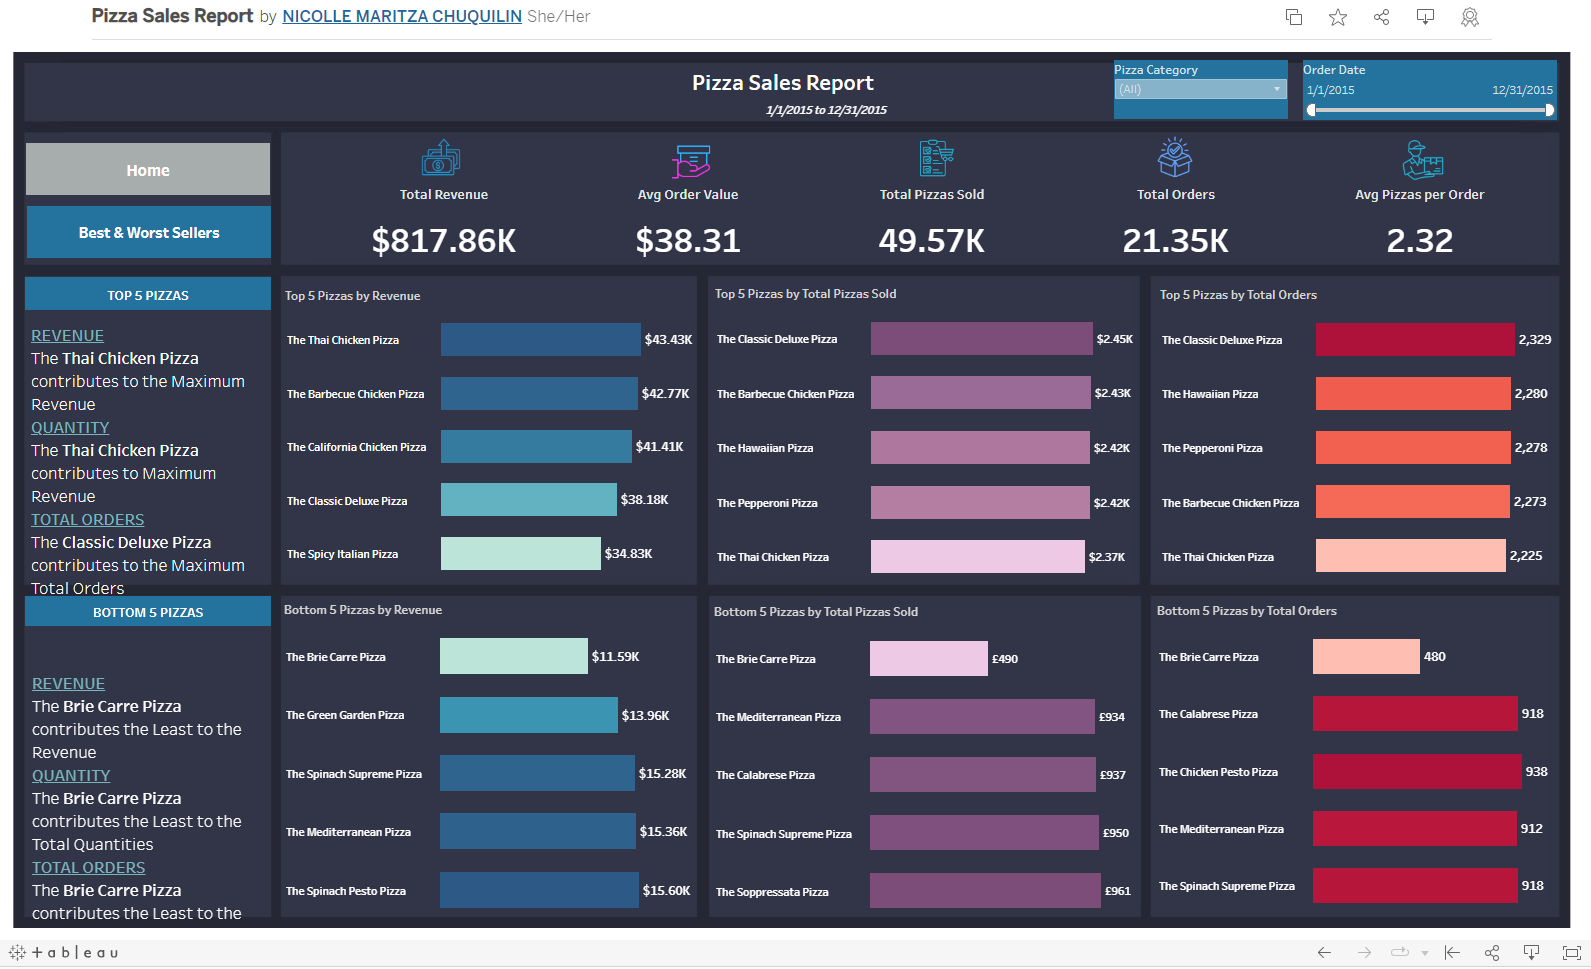
I undertook a comprehensive data management and analysis project utilizing SQL. This project aimed to extract meaningful insights from Pizza Sales Data, focusing on critical business performance indicators. I calculated and analyzed key metrics, including Total Revenue, Total Pizzas Sold, Average Pizzas Per Order, Total Orders, and Average Order Value. To further delve into essential trends and patterns, I conducted an examination of Hourly and Weekly trends for Total Pizzas Sold, assessed the Percentage of Sales by Pizza Category and Pizza Size, and identified the Bottom and Top 5 Best Sellers based on Revenue, Total Quantity, and Total Orders.
With a commitment to presenting data-driven insights in a visually engaging manner, I leveraged this analyzed data to create an interactive and visually intuitive Tableau Dashboard. This dashboard not only serves as a testament to my data analysis skills but also provides a clear and insightful representation of the findings, facilitating informed decision-making and strategic planning.
Tools: MySQL and Tableau
Tech Language: SQL
View my Interactive Tableau Dashboard on Tableau Public
View my Data Analysis in MySQL on GitHub