Food-Hub: EDA in Python and PowerBI Dashboard
In this MIT PE project, I conducted an Exploratory Data Analysis (EDA) of FoodHub's operational data to uncovered valuable insights that can shape strategic decisions and elevate the overall customer experience. This analysis serves as a guiding compass for optimizing various facets of the business, from customer feedback incentivization to pricing strategies, with the ultimate goal of enhancing customer engagement, loyalty, and business success.
The findings highlight the power of customer feedback, the influence of different days on order patterns, the significance of cuisine popularity and cost dynamics, and the intriguing relationship between spending and satisfaction. By leveraging these insights, FoodHub can implement targeted strategies that resonate with customers, create a competitive edge, and foster meaningful connections.
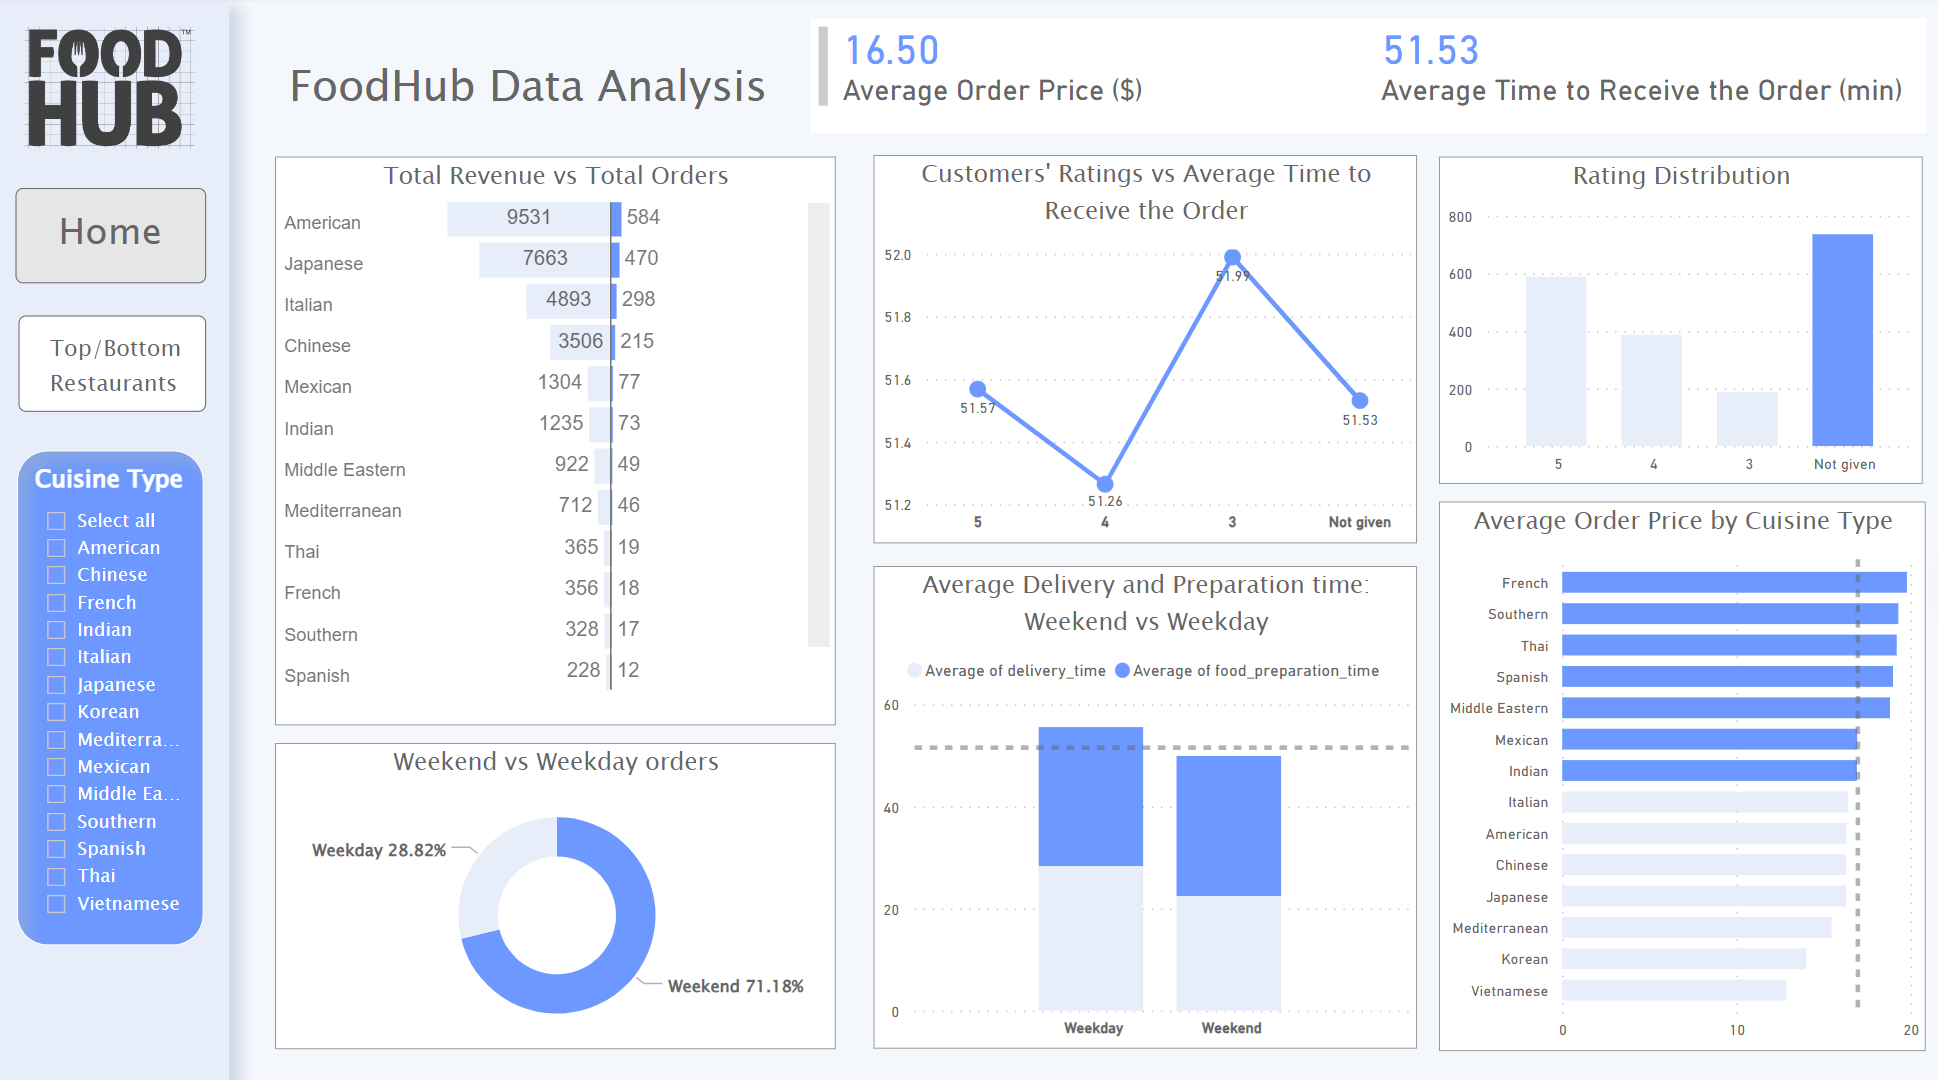
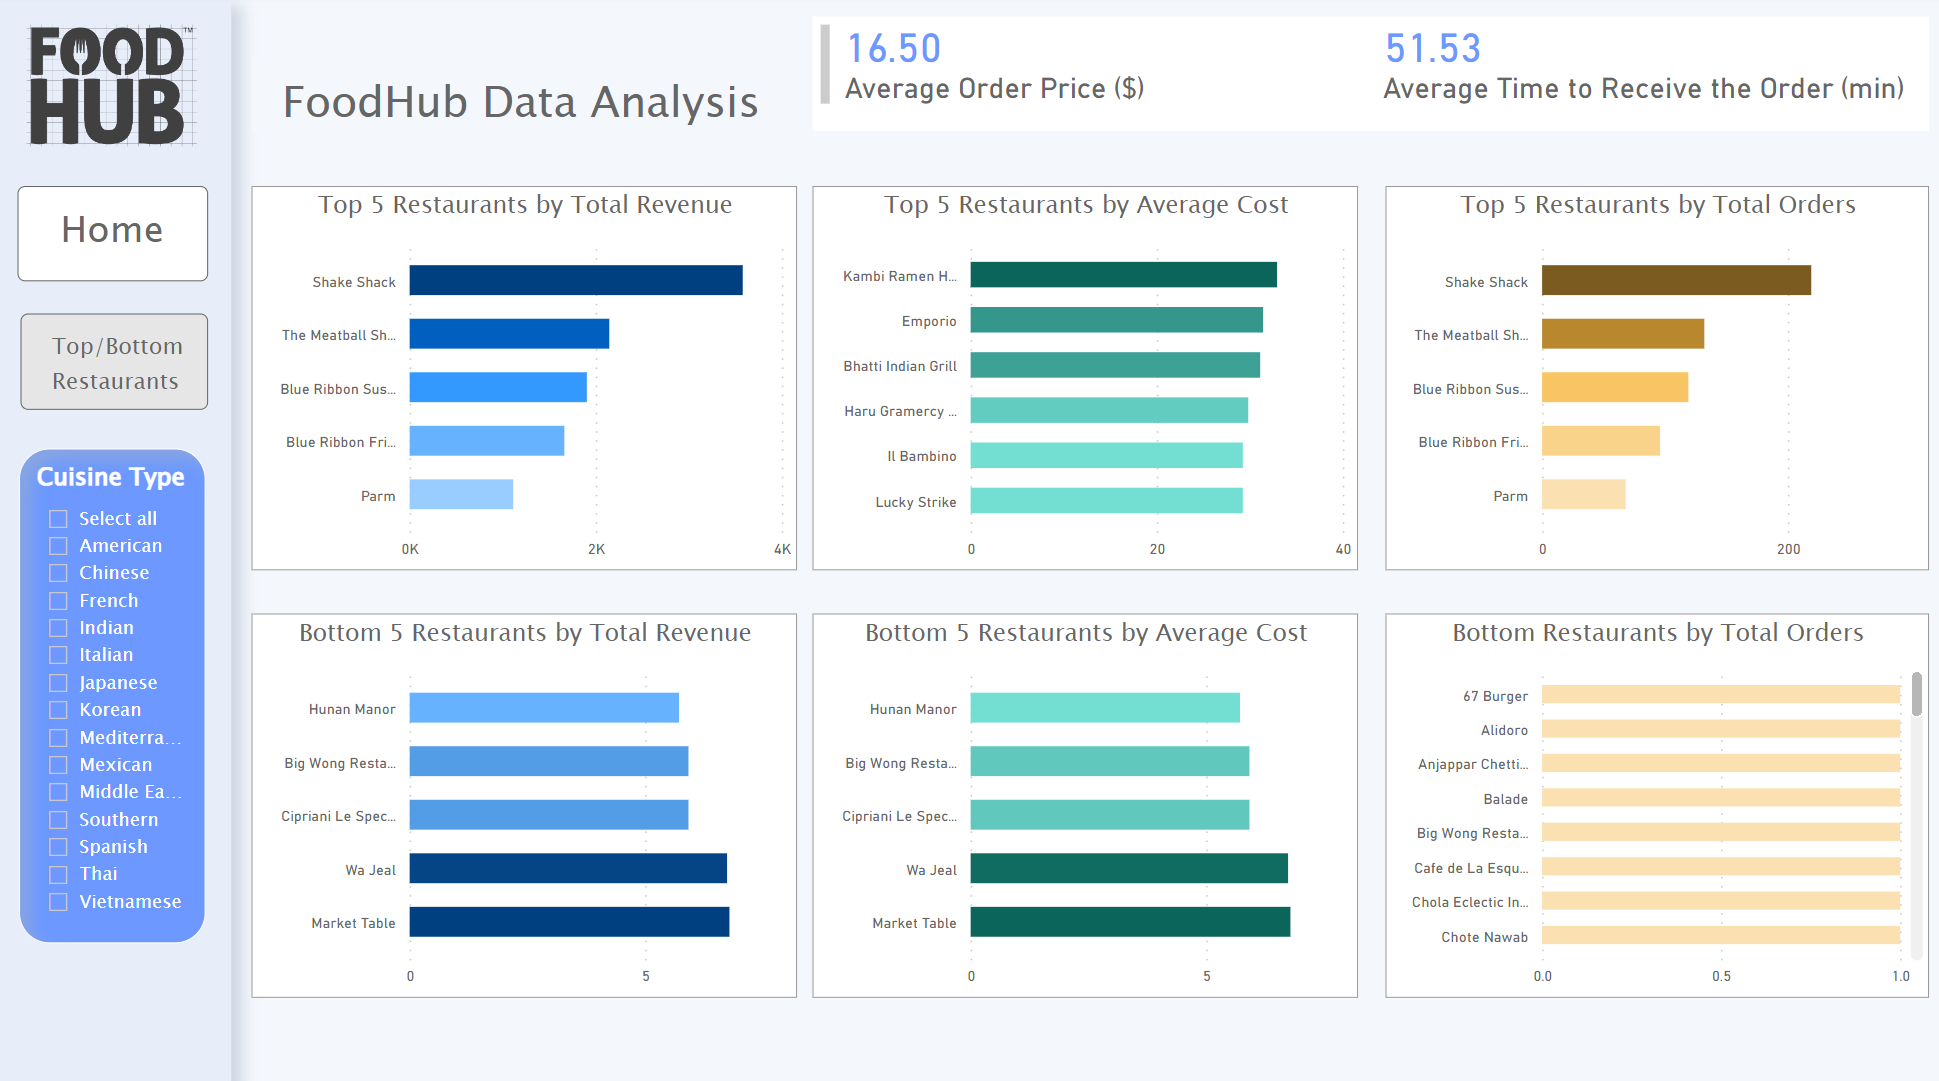
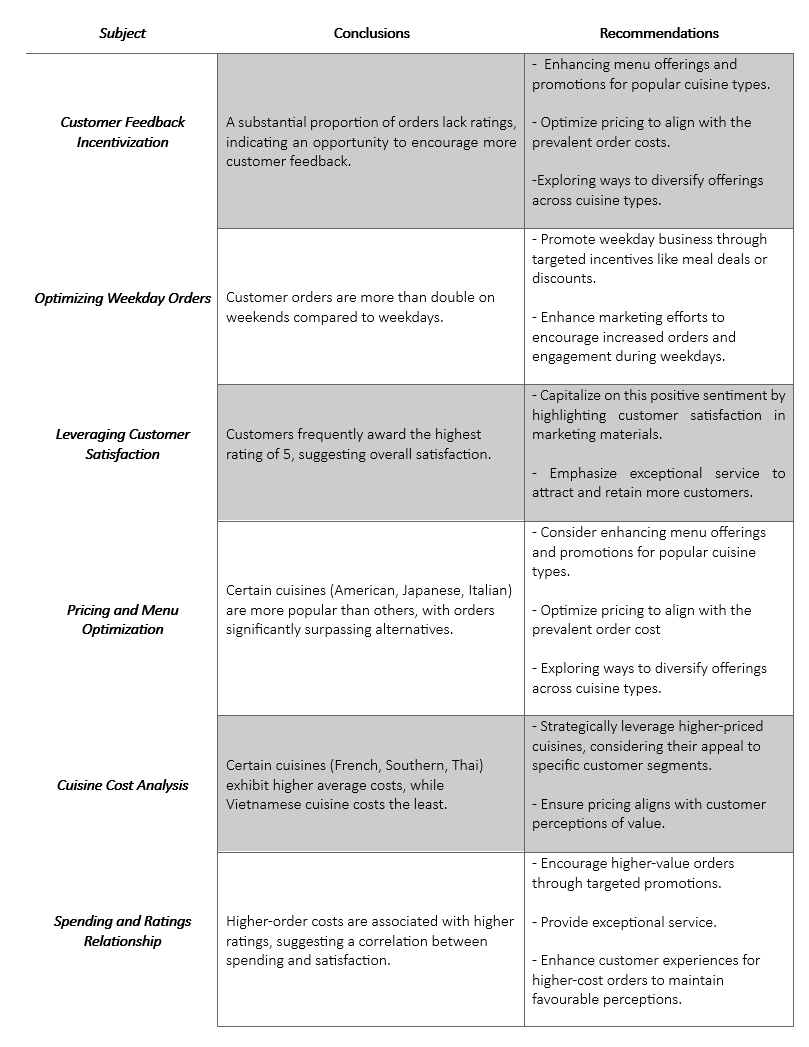
To bring these insights to life, I crafted a dynamic PowerBI dashboard and a concise PDF table, providing a visually compelling and data-rich presentation of conclusions and actionable recommendations.
Tool: Visual Studio Code, PowerBI
Tech Language: Python
View my EDA in Python on Github
View my PowerBI Dashboard on Github
View my Conclusions and Recommendations table on Github
Conclusions and Recommendations table


