Uber Project: EDA in Python and PowerBI Dashboard
Uber Technologies, Inc., a global leader in the transportation network industry, operates in over 72 countries and serves 10,500 cities. As of the fourth quarter of 2021, Uber boasted an impressive 118 million monthly active users worldwide, facilitating an average of 19 million trips daily.
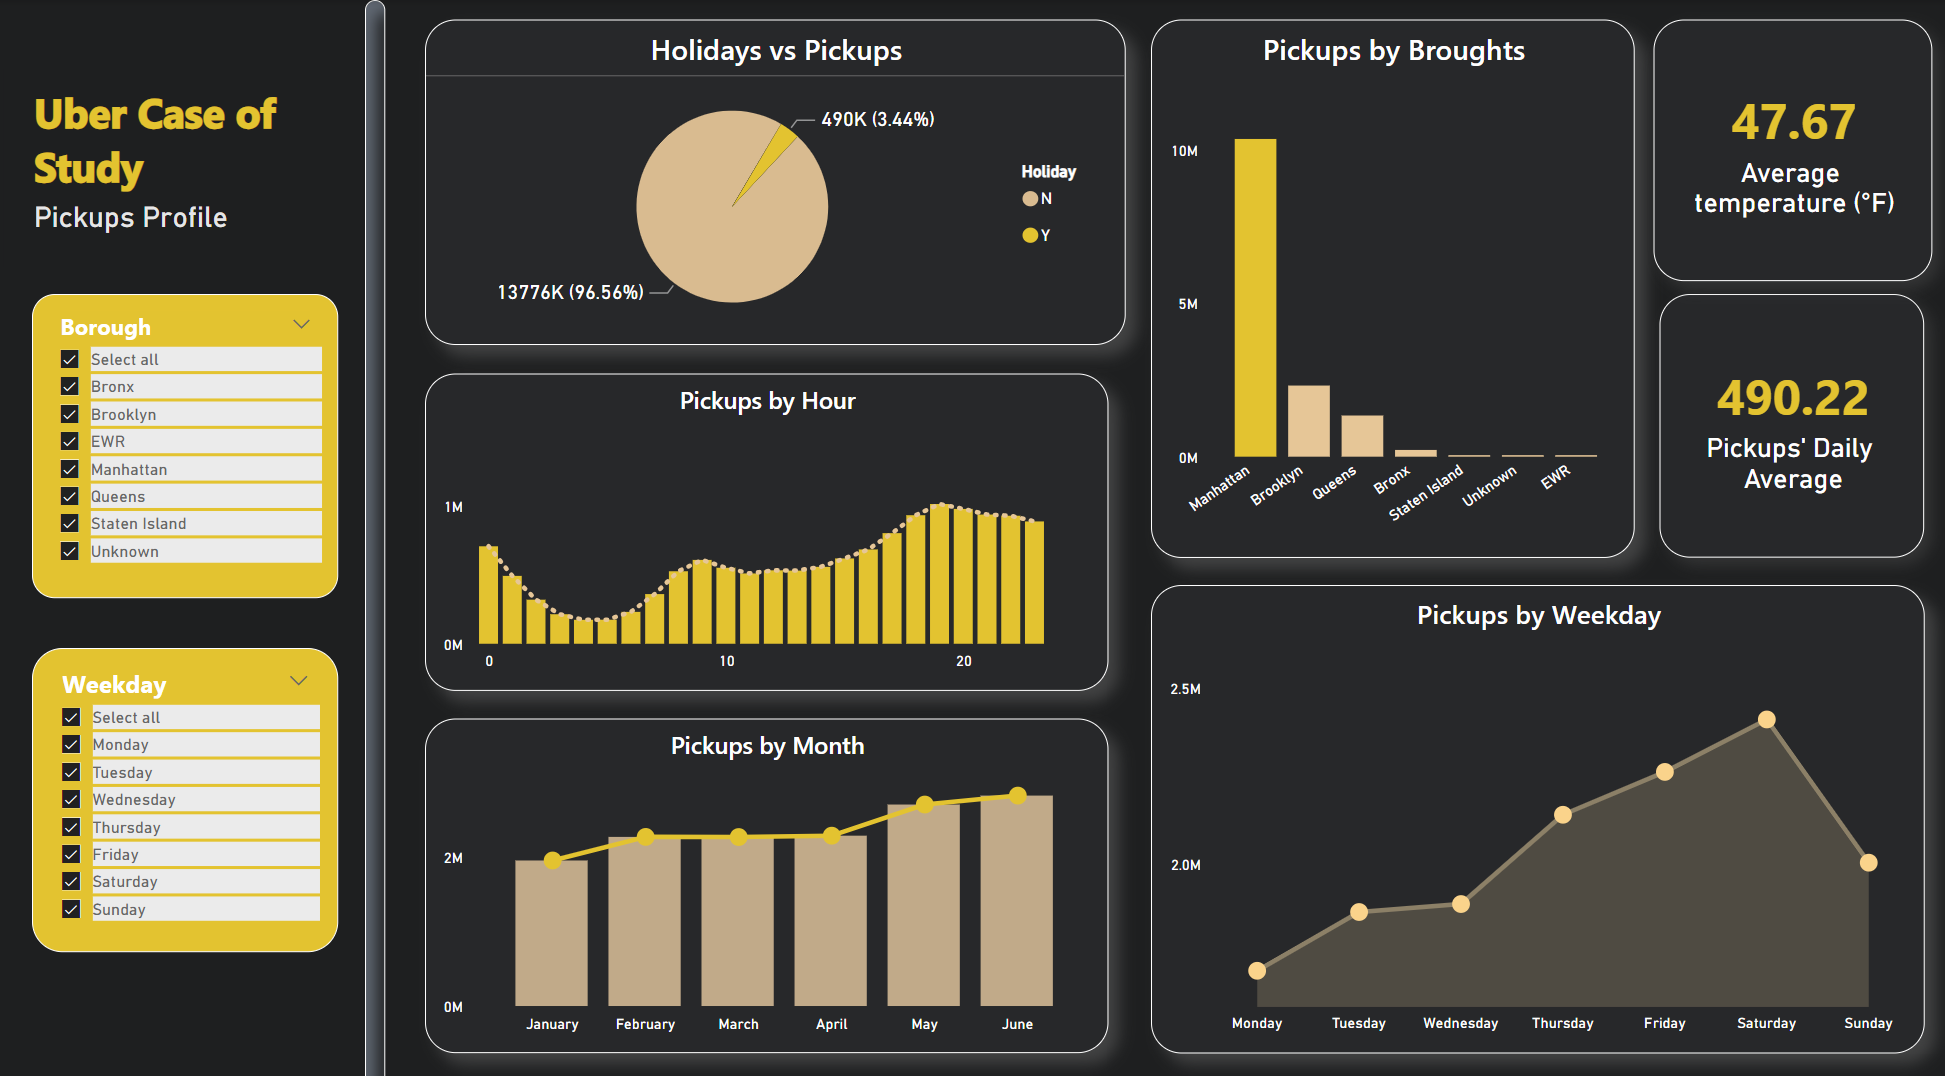
In this MI PE Project, I did an Exploratory Data Analysis (EDA) to extract insights and determine patterns from 30K hourly Uber pickup data from New York boroughs. My objective was to help Uber with a comprehensive understanding of its demand profile and facilitate strategic actions that would elevate business outcomes.
In addition to this, I designed a dynamic Power BI dashboard to vividly showcase the findings. This interactive platform was carefully crafted to offer a compelling visual narrative of Uber' pickups profile, allowing everyone to delve into the insights and make informed decisions.
Tool: Visual Studio Code, PowerBI
Tech Language: Python
View my PowerBI Dashboard on Github
View my EDA in Python on GitHub