London Bike’s Moving Average in Tableau
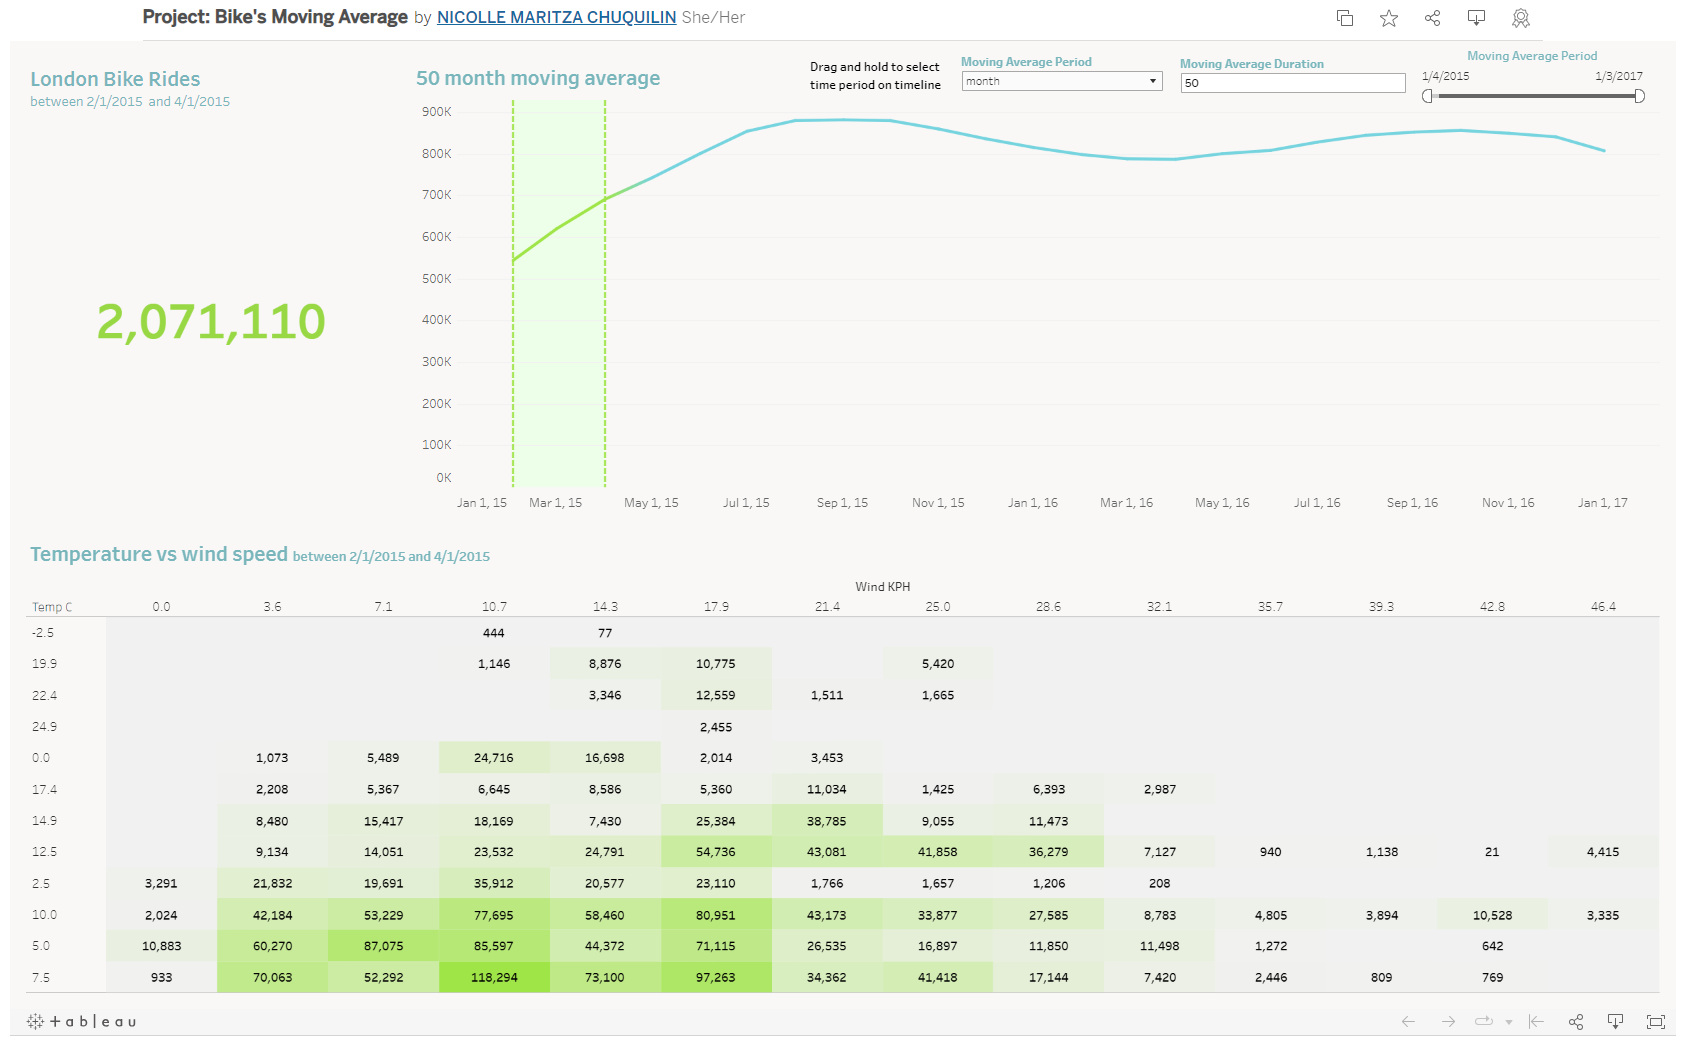
In this repository, I've created an interactive Tableau dashboard using the London bike-sharing dataset from Kaggle (available here). The dataset was initially processed in Python to manage the data effectively. Later, it was imported to Tableau, where I created a dashboard that showcased the moving average of London bike rides and explores the correlation between temperature, wind speed and bike rides. Giving, in this way, an interactive illustration of London Bike's Moving Average
Tool: Tableau
Tech Language: Python
View my Interactive Tableau Dashboard on Tableau Public
View my Data Preparation in Python on GitHub